Radio Wave Propagation
The purpose of this article is to share the tools for assessing how well your communications might make it from one point to another. In order to understand what the tools are doing, let’s lay some groundwork.
Table of Contents
Radio Waves
If you’re an amateur radio operator, one of the first things you learn in your studies is that energy moves in waves. Radio waves are a form of energy in the electromagnetic spectrum, the same spectrum that includes visible light. Thusly, radio waves travel at about the speed of light, about 300 million meters per second.

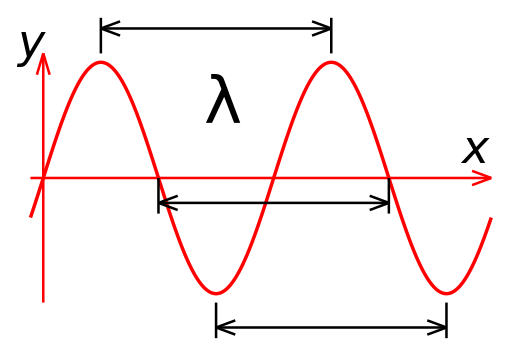
The cycles per second, or frequency of these waves, are measured in hertz, as named for the scientist Heinrich Hertz, who discovered radio waves. Thusly, the higher the frequency, the shorter the wavelength or space between those waves. The lower the frequency, the longer the wavelength.

Propagation
Radio propagation is essentially the ability of a transmission to make it from one point to another, how it makes it there, and what effect obstacles have on its travel. For a more detailed description on the science behind it, please refer to the ARRL Ham Radio License Manual or Wikipedia. It’s a very involved scientific topic, and there are many data models that try to predict the ability to communicate over a distance.
The important notions, for planning what frequency to use, and what to expect from it:
- The lowest frequencies (ELF starting at 3 Hz through HF up to 30 MHz) will bounce off the ionosphere at varying layers, and travel greater distances around the globe.
- The more activity in the ionosphere, caused by solar weather, the more likely signals will travel within the planet.
- LF starting at 30 KHz through MF up to 3 MHz work well with ground wave propagation, the longer wavelengths wrapping around and over obstacles with ease.
- VHF at 30 MHz and up are typically limited to site-to-site
- The lower of the frequency ranges occasionally capable of ionospheric refraction and ducting.
- The higher frequencies are more capable of penetrating structures.
Again, for more specifics, please refer to the license manual or the Wikipedia article on radio propagation.
Measurement
Radio Propagation can be measured and reported on, to help operators jump on the air when the bands are “open”, meaning conditions are favorable to effectively get your signal out there.
Beacons
Radio Propagation Beacons periodically transmit their IDs to allow operators to identify when a band is open, and from where. A list of beacons can be found at http://www.dxinfocentre.com/ndb.htm.
Like the beacons, folks are using APRS telemetry to report on how far away from a source they are receiving a VHF 2-meter signal, in the form of a map of the US.
DX Clusters
For operators looking for DX, or making a communication over a great distance, the DX Cluster is there to record and share reports from amateur radio operators. These reports are submitted to a DX Node by an operator, and like packet radio, the node “stores and forwards” the information with a Cluster; “store and forward” meaning a copy of the information is kept and made accessible to local operators connected to the node, and forwarded to other nodes for dissemination.
While many DX Nodes will often display this information on a web page in the form of a list, graph or map to make it easier to identify what bands are active, the information is actually shared over telnet and packet radio to DX Cluster nodes.
The information consists simply of the operator’s callsign, the frequency, a timestamp of when the communication occurred, the DX contact’s callsign, and a brief comment about the interaction.
There are several DX Node websites popular with amateur radio operators, many offering their own special flare for displaying the information from the Cluster, and including other tools that are helpful to the radio operator. Lists are filterable, and auto-refresh, highlighting new entries as they roll in.
- HRDLOG.net – Offers a basic QSO or contact list on their front page, color coded by band and listing the mode. They also include tools such as a chat room, morse trainer, contest list, net list and webcams
- DX Summit – Simple yet very filterable and searchable QSO list
- CRX-Ham – Run by Bastien Barbe F4EYQ has the usual filterable list of contacts, and adds (from his Twitter feed) “tools based on Machine Learning, it run[s] with dxcluster spots data and NOAA data and can be used to study MUF” (Maximum Usable Frequency)
- QRZ.com – The Swiss Army knife of amateur radio. For DX QSOs, click on DX Spotting Network in their Database menu. This website also offers forums, for sale ads, news, license training and sample tests, and of course, it’s primary function of callsign / contact info lookup.
- N1MM Logger – This popular logging application can connect to DX Nodes and Clusters over Telnet.
Prediction
Prediction of propagation requires an understanding of the above principles, and data modeling tools.
Line-of-sight situations
Not taking into account tropospheric ducting, the following tools can give you an idea how well you’ll reach from point A to point B.
- Google Earth‘s Elevation Profile can be used to provide a basic understanding of how the terrain may affect line of sight propagation
- Radio Mobile is a data modelling tool that takes many sources of data into account. Setup can be a bit daunting, but the output is very useful. Set the height of the two antennas, and it’ll give you an idea how well you’ll be heard. See the author’s About page for more details on how it works. I’ll write up an article on how I set it up, soon.
Ionospheric
For those wishing to bounce the radio waves off of the world’s ionosphere, or even punch through it, it’s worth being aware of the conditions of the ionosphere and what the sun is doing to it; i.e.: solar flux measured in the k and a indeces.
- Scientist Dr Tamatha Skov, the Space Weather Woman, provides a space weather report that tells us how space weather may affect: GPS, Emergency Service Radio, Amateur Radio and Aurora Photography.
- As mentioned above, experimenters are beginning to use Machine Learning to gather DX Cluster data and NOAA statistics to form an educated guess as to what the bands will do, and an operator’s success in reaching a given destination. Reference: http://ham.crz.cloud
Suggestions?
Have a favorite tool or website? Please let me know in the comments, below!
